Three questions about your money, three views
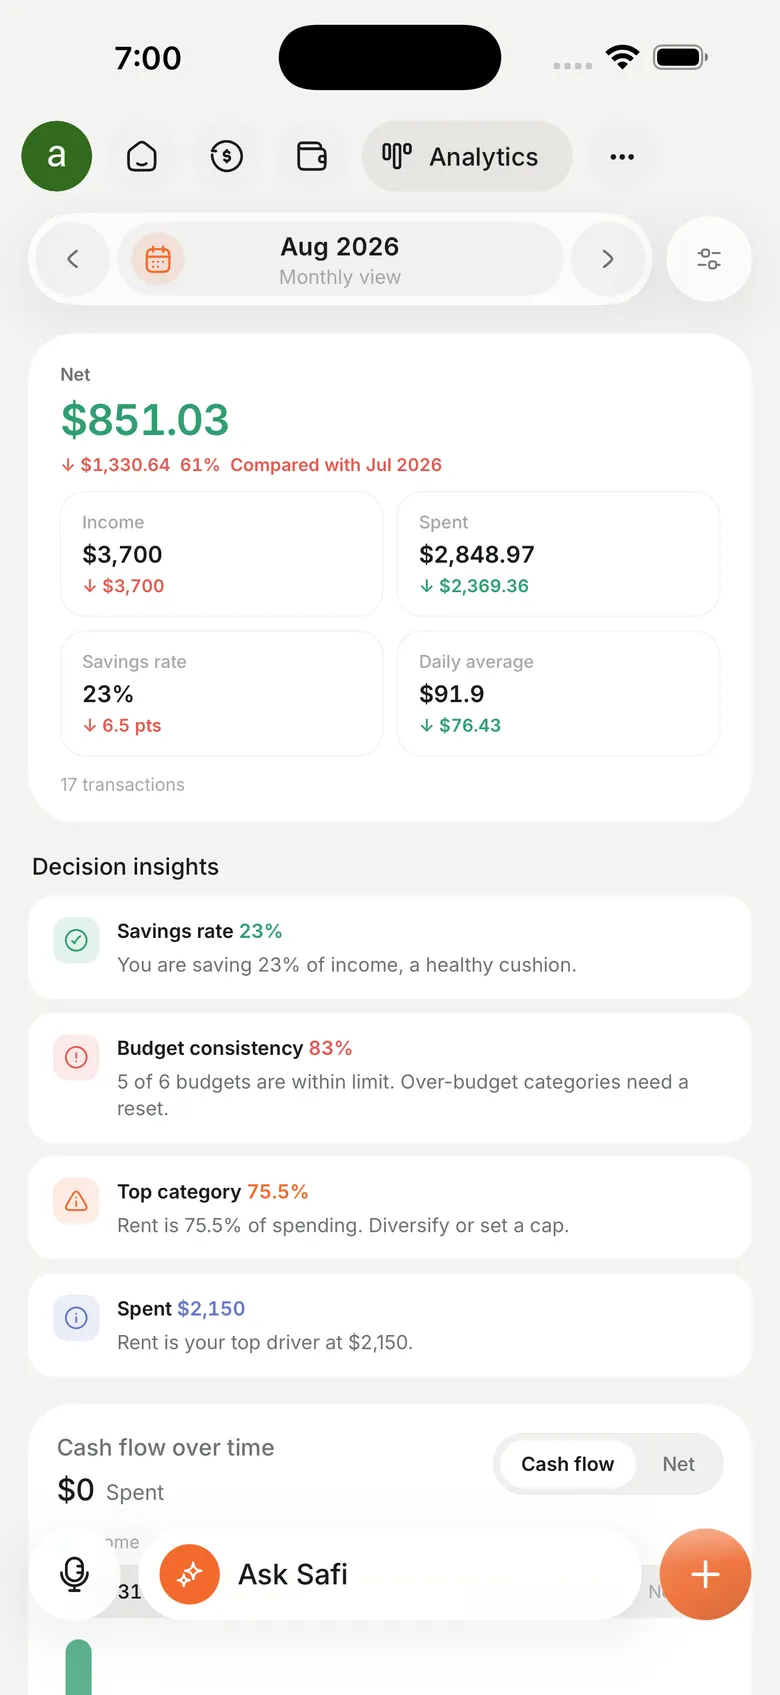
What came in, what went out, and what was left over are separate questions. Safi answers them on separate screens instead of stacking six charts on one.
Pro
Spending
Opens on a donut and a grid of every category, so the split is readable before you have decided what you are looking for. Tap a category to see the transactions inside it.
Safi also compares the period against the one before it and reports what actually moved. A category has to change by enough proportionally and by enough in money to be worth telling you about. A grocery bill up forty percent matters; a stationery bill up forty percent on eleven pounds does not, and reporting it trains you to skim.
Cash flow
Follows the leftover. What you spent, what you moved into savings, and what is still unspent, with ribbons fading toward where the money landed. Tapping a bar opens the list behind it.
This is the view that answers the awkward question of where a good month went. Income minus spending looks fine until you notice that most of the difference went into a savings goal, or that it did not.
Starting from a list instead of a chart
Sometimes you already know the slice you care about. Narrow your transactions by category, account, tag or date, then use Open in Analytics and the same slice arrives on the chart. You do not rebuild the filter twice in two places.
Every view takes a period: a month, a year, or a custom range, switched from the caret in the corner. Analytics is part of Pro. The category breakdown on your Dashboard is not, and it is free forever.
- Income, Spending and Cash Flow, switched at the top
- Any month, year or custom range
- Open in Analytics carries a filtered transaction list straight to the chart
Questions people ask
Is analytics free?
The category breakdown on your Dashboard is free and always will be. The three analytics views, the period comparisons and the filters are part of Pro.
Can I compare two months?
Safi compares the period you are looking at against the one immediately before it of the same length, and reports the categories that moved enough to matter in both proportion and money.
Does it work with several currencies?
Yes. Every figure is reported in the base currency you chose, converted from whatever each account holds.